X (Twitter) Revenue and Growth Statistics: 2024

Key Twitter user stats. Includes data on revenue, profit, valuation, market capitalization, number of employees, and more.
X (Twitter) Revenue and Growth Statistics: 2024
Last updated on:
February 1, 2024
Want more research posts like these for FREE?
Want more insights like these for FREE?

Twitter Interesting Key Facts

  • Twitter was originally created for Odeo, a podcasting company.
  • In 2006, Jack Dorsey, one of the co-founders and former CEO of Twitter, came up with an idea of an SMS service to communicate with a small group.
  • The first tweet was by Jack Dorsey, it said “just setting up my twittr”.
  • In 2006, Twitter was called twittr before because the domain name was already owned by another business. The name was changed from twittr to Twitter after the domain was purchased by the crew.
  • On August 3, 2013, Japan set the highest record for most tweets sent amounting to 143,199 tweets per second during a television screening of Hayao Miyazaki’s Castle in the Sky.
  • Twitter is considered the number 1 platform for discovery.
  • People spend 26% more time on Twitter viewing ads than on other leading platforms.
  • Twitter is considered the largest microblogging platform.
  • A tweet has a maximum capacity of 280 characters.
  • In July 2022, Twitter launched a lawsuit case against the government of India after they were ordered to remove multiple accounts and tweets that violated the country’s law.
  • Elon Musk bought Twitter for $44 billion through debt financing.
  • Twitter's logo changed to an "X" in late July 2023.

Sources: New York Times, CNN, Twitter 1, Twitter 2, Twitter 3, New York Times, Reuters

Twitter: Company Overview (About)

Key InfoKey Stat
TypePrivate
IndustrySocial Media
FoundedMarch 21, 2006
FoundersJack Dorsey, Noah Glass, Biz Stone, Evan Williams
HeadquartersSan Francisco, California , United States
Key PeopleElon Musk
ServicesTwitter
 Vine
 Periscope
Revenue$5.08 billion
Operating Income-$273 million
Net Income-$221 million
Total Assets$14.1 billlion
Total Equity$7.3 billion
Number of Employees7,500 (2021)
Websitehttps://twitter.com/

Source: Twitter

When did Twitter logo changed?

Twitter's logo changed to an X on July 24th, 2023. The concept was clarified in October 2022, when Elon Musk tweeted that purchasing Twitter was "an accelerant to creating X, the everything app".

Elon Musk's tweet about the X logo in 2022

Source: Elon Musk's tweet in October 2022.

How much does Twitter charge for the blue check mark?

It now costs $7.99 a month to be verified on Twitter. Elon Musk brought down this judgment with the reasoning that there are a lot of bots and fake accounts on Twitter. He believes that by charging this amount of money, this would decrease the number of bots and fake accounts on the platform.

TimeBlue Check Cost
October 2022$20.00
November 2022$7.99

Source: BBC, CBS News, The Verge, Platformer

When was Twitter delisted from public markets?

Twitter was delisted from the New York Stock Exchange last November 08, 2022. When Elon Musk completed his acquisition of Twitter, it changed the company from a publicly traded company to a privately owned company.

Data about Twitter’s financials on Google Finance was also removed.

Source: Quartz

How much money did Elon Musk spend to buy Twitter?

Elon Musk spent $44 billion to buy Twitter. The acquisition was initiated on April 14, 2022 and concluded on October 27, 2022.

Source: ABC News

How does Twitter make money?

Twitter makes money through ads. Their revenue can be divided into two segments: Advertisements, and Data Licensing & Others.

Twitter creates targeted ads for business profiles using advertising formats. This includes: Promoted Ads, Twitter Amplify, Follower Ads, and Twitter Takeover.

Source: Wealth of Geeks

What is Twitter’s Revenue?

Twitter had revenues of $5.08 billion in 2021, an increase of 36.56% in year-over-year growth.

YearRevenueY/Y Change
2011$106.31 million
2012$316.93 million198.12% increase
2013$664.89 million109.80% increase
2014$1.40 billion110.56% increase
2015$2.22 billion58.57% increase
2016$2.53 billion13.96% increase
2017$2.44 billion-3.56% decrease
2018$3.04 billion24.59% increase
2019$3.46 billion13.82% increase
2020$3.72 billion7.51% increase
2021$5.08 billion36.56% increase

Source: Twitter

What is Twitter’s Ad Revenue?

Twitter had an ad revenue of $4.51 billion in 2021. It increased by 40.50% compared to $3.21 billion in ad revenue in 2021.

YearAdvertising RevenueY/Y Change
2011$77.7 million
2012$269.42 million246.74% increase
2013$594.55 million120.68% increase
2014$1.26 billion111.93% increase
2015$1.99 billion57.94% increase
2016$2.25 billion13.07% increase
2017$2.11 billion-6.22% decrease
2018$2.62 billion24.17% increase
2019$2.99 billion14.12% increase
2020$3.21 billion7.36% increase
2021$4.51 billion40.50% increase

Source: Twitter

Twitter Data Licensing & Other Revenue

Aside from advertising, Twitter also earns from other segments such as data licensing. In 2021, Twitter earned $571.79 million from data licensing and other revenue.

YearData Licensing & OthersY/Y Change
2011$28.60 million
2012$47.5 million66.08% increase
2013$70.34 million48.08% increase
2014$147.31 million109.43% increase
2015$224.00 million52.06% increase
2016$281.57 million25.70% increase
2017$333.31 million18.38% increase
2018$424.96 million27.50% increase
2019$465.94 million9.64% increase
2020$508.96 million9.23% increase
2021$571.79 million12.34% increase

Source: Twitter

How much money does Twitter spend on sales and marketing?

In 2021, Twitter spent $1.18 billion on their sales and marketing.

YearAnnual ExpenditureY/Y Change
2010$6.29 million
2011$25.99 million313.20% increase
2012$86.55 million233.01% increase
2013$316.22 million265.36% increase
2014$614.11 million94.20% increase
2015$871.49 million41.91% increase
2016$957.83 million9.91% increase
2017$717.42 million-25.10% decrease
2018$771.36 million7.52% increase
2019$913.81 million18.47% increase
2020$887.86 million-2.84% decrease
2021$1.18 billion32.90% increase

Source: Twitter

Twitter Profit

Twitter has -$221 million in profit in 2021.

YearProfitY/Y Change
2010-$67 million
2011-$164 million-144.78% decrease
2012-$79 million51.83% increase
2013-$645 million-716.46% decrease
2014-$578 million10.39% increase
2015-$521 million9.86% increase
2016-$457 million12.28% increase
2017-$108 million76.37% increase
2018$1.21 billion1220.37% increase
2019$1.47 billion21.49% increase
2020-$1.14 billion-22.45% decrease
2021-$221 million-119.386% decrease

Source: Twitter 1, Twitter 2

How much is Twitter worth? (Valuation)

Before going public, Twitter was valued at $9.25 billion in 2011.

YearValuation
2007$35 million
2008$104 million
2009$1.18 billion
2010$3.64 billion
2011$9.25 billion

Sources: Pitch Book, Tech Crunch

What is Twitter’s market cap?

Twitter have a market capitalization of $41.09 billion in 2023, an increase of 7.65% in year-over-year growth compared to last year’s $38.17 billion.

YearMarket CapY/Y Change
2013$36.27 billion
2014$23.04 billion-36.48% decrease
2015$16.06 billion-30.30% decrease
2016$11.65 billion-27.46% decrease
2017$17.83 billion53.05% increase
2018$21.96 billion23.16% increase
2019$24.98 billion13.75% increase
2020$43.06 billion72.38% increase
2021$34.55 billion-19.76% decrease
2022$38.17 billion10.48% increase
2023$41.09 billion7.65% increase

Source: Companies Market Cap

How many people work at Twitter?

Twitter hired 2,000 more employees in 2021, raising the number of employees to 7,500.

YearNumber of EmployeesY/Y Change
20088
200929262.5% increase
2010130348.28% increase
2011350169.23% increase
20121,500328.57% increase
20132,71280.80% increase
20143,63834.14% increase
20153,9007.20% increase
20163,583-8.13% decrease
20173,372-5.89% decrease
20183,92016.25% increase
20194,90025.00% increase
20205,50012.24% increase
20217,50036.36% increase

As of November 2022, Twitter has 2,750 employees left.

Source: Twitter

Twitter Employees: Gender Distribution 2022

YearMaleFemale
201470.00%30%
201663.00%37%
201761.60%38.40%
201859.80%40.20%
201958.00%42%
202056.70%42.60%
202153.90%44.70%

Source: Statista

How many employees did Elon Musk fire from Twitter?

Elon Musk fired more than half of Twitter’s employees and the rest resigned from the company. There were only 2,750 employees left on Twitter from 7,500 employees when Elon Musk took over the company.

Source: Los Angeles Times, SF Chronicle

How many people use Twitter? (Monthly Active Users)

YearMonthly Active Users
2013240.9 million
2014288.0 million
2015305.0 million
2016319.0 million
2017330.0 million
2018321.0 million
2019312.7 million
2020347.6 million
2021362.4 million
2022436 million

Source: Twitter

How many DAU does Twitter have globally?

Twitter had 217 million monetizable daily active users last 2021. Twitter started counting their DAU in 2018.

YearDAU (Global)
2017115 million
2018126 million
2019152 million
2020192 million
2021217 million

Source: Twitter

How many DAU does Twitter have in the U.S.?

Twitter had 38 million monetizable daily active users on Twitter in the U.S.

YearDAU (U.S.)
201725 million
201827 million
201931 million
202037 million
202138 million

Source: Twitter

How many DAU does Twitter have outside the U.S.?

There are 179 million monetizable daily active users (DAU) in Twitter.

YearDAU (International)
201789 million
201899 million
2019121 million
2020155 million
2021179 million

Source: Twitter

What is the average age of Twitter users?

More than one-third of Twitter users are aged 25-34. Meanwhile, Twitter users with ages below 18 compromises 6.6% of the total Twitter user base.

Age RangePercentage
13-176.60%
18-2417.10%
25-3438.50%
35-4920.70%
50+17.10%

Source: Statista

Twitter Users Age Distribution in the U.S.

Almost half of the people using Twitter in the U.S. are ages 18-29 while 5% of the platform’s users are more than 65 years old.

Social MediaAges 18-29Ages 30-49Ages 50-64Ages 65+
Twitter43%38%14%5%
Facebook23%41%22%14%
Youtube27%40%22%11%
Instagram44%37%13%5%
Reddit44%47%8%1%
Tiktok52%34%12%2%
Linkedin25%46%20%8%
Snapchat63%32%3%1%

Source: Pew Research: News Consumption Across Social Media in 2021

How many males are using Twitter?

67.33% of Twitter users are male.

GenderPercentage
Male67.33%
Female32.67%

Source: Similarweb

How many people regularly source news from Twitter?

A study by Pew Research shows that 55% of Twitter users regularly get news coming from the platform in 2021.

Social MediaPercentage (2020)Percentage (2021)
Twitter59%55%
Facebook54%47%
Reddit42%39%
Youtube32%30%
TikTok22%29%
Instagram28%27%
Snapchat19%16%
LinkedIn15%14%
WhatsApp13%14%
Twitch11%13%

Source: Pew Research: News Consumption Across Social Media in 2021

Who has the most followers on Twitter?

RankAccount Owner@handleNumber of Followers
#1Barack Obama@BarackObama133.3 million
#2Elon Musk@elonmusk125.1 million
#3Justin Bieber@justinbieber113.6 million
#4Katy Perry@katyperry108.7 million
#5Rihanna@rihanna107.5 million
#6Cristiano Ronaldo@Cristiano106.8 million
#7Taylor Swift@taylorswift1392.2 million
#8Lady Gaga@ladygaga84.9 million
#9Narendra Modi@narendramodi85.7 million
#10Youtube@YouTube78.2 million
#11Ellen DeGeneres@EllenDeGeneres76.8 million
#12Kim Kardashian@KimKardashian74.6 million
#13NASA@NASA69.4 million
#14Selena Gomez@selenagomez66.5 million
#15Twitter@Twitter66.1 million
#16CNN Breaking News@cnnbrk64.1 million
#17Justin Timberlake@jtimberlake62.6 million
#18Bill Gates@BillGates61.6 million
#19Neymar Jr@neymarjr61.1 million
#20CNN@CNN60.9 million

Source: Twitter

How many tweets are being sent each day?

Around 500 million tweets are being sent each day. There are also around 5,700 tweets being sent per second and around 342,000 tweets sent per minute.

TimeNumber of Tweets
Per Second5,700
Per Minute342,000
Per Day500 million

Source: Twitter

Who has the most retweeted tweet?

Yusaku Maezawa, a Japanese billionaire and art collector, owns the most retweeted tweet of all time. His tweet has been retweeted 3.7 million times.

Source: Twitter

How many Twitter accounts have the blue check mark?

There are 424,000 verified accounts with blue check marks on Twitter in 2022.

RankPosted byDate PostedContextNumber of Retweets
1Yusaku Maezawa @yousuck2020Jan 5, 2019Yusaku Maezawa promised to award a prize of 100 million yen to a random winner among people who retweeted his tweet.3.7 million
2Carter Wilkerson @carterjwmApr 6, 2017Wendy's promised Carter to give a year of free chicken nuggets if his tweet would be retweeted 18 million times. It didn't even take that much retweets when Wendy's decided to fulfill that promise.3 million
3Yusaku Maezawa @yousuck2020Dec 31, 2019Yusaku Maezawa promised again to award a prize of 1 billion yen to a random winner among people who retweeted his tweet.2.9 million
4Ellen DeGeneres @TheEllenShowMar 2, 2014Star-studded selfie with various actors who attended the 85th Academy Awards.2.8 million
5Louis Tomlinson @Louis_TomlinsonOct 2, 2011Louis Tomlinson tweeting to Harry Styles telling him he is always in his heart.2.6 million
6Chadwick Boseman @chadwickbosemanAug 29, 2020Chadwick passing away.1.9 million
7Hikakin @hikakinDec 18, 2021Giveaways tweet with 103 iphone 13s to people who would retweet his tweet.1.6 million
8Jungkook @BTS_twtMay 3, 2020Video clip of Jungkook singing.1.5 million
9El Rubius @Rubiu5Aug 21, 2016Drawing of prizes for people who retweeted his tweet "LIMONADA"1.4 million
10Barack Obama @BarackObamaAug 12, 2017Barack Obama quoting a passage from Nelson Mandela's autobiography "Long Walk to Freedom".1.4 million
YearVerified Accounts
20105,000
2014116,000
2018311,000
2022424,000

Source: Statista

How much time do people spend on Twitter?

Globally, people spend an average time of 10.62 minutes per day in using Twitter.

In the U.S., people spend an average of 34.80 minutes per day on Twitter.

Source: Similarweb

Where is Twitter available (in which countries)?

Twitter is available in almost every country. However, there are countries where the government mandated to block Twitter either temporarily or permanently.

CountryAccess Type
ChinaPermanently Blocked
IranPermanently Blocked
North KoreaPermanently Blocked
RussiaPermanently Blocked
TurkmenistanPermanently Blocked
UzbekistanPermanently Blocked
EgyptTemporary Blocked (2011)
NigeriaTemporary Blocked (2021-2022)
TurkeyTemporary Blocked (2014)

Sources: Censhorship and deletion practices in Chinese social media,  Bloomberg, Global News, Net Blocks, BBC, Eurasianet, CS Monitor, India Express

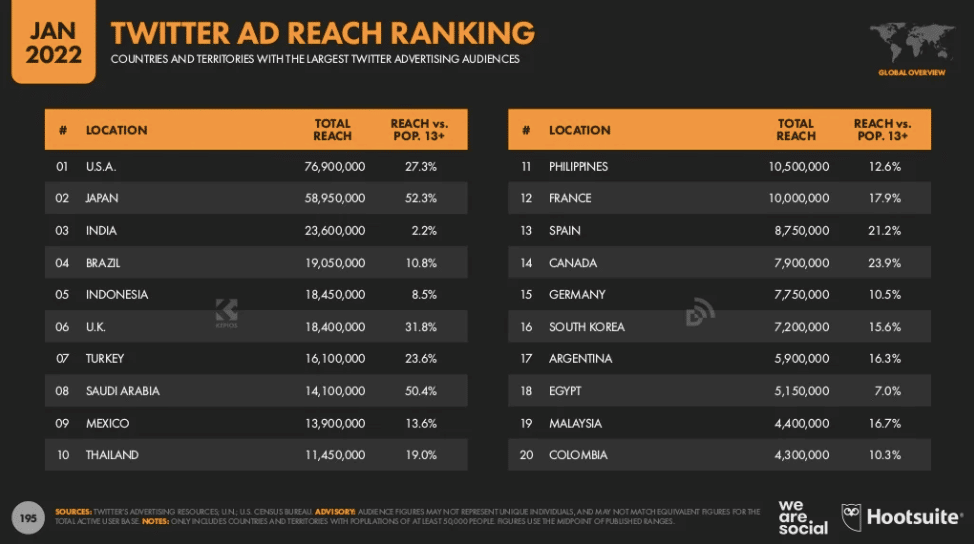
Which countries have the highest Ad Reach on Twitter?

Surprisingly, Japan is the country with the highest Ad Reach with 52.3%

RankCountryTotal ReachReach vs. Total Population
#1U.S.A.76.9 million27.30%
#2Japan58.95 million52.30%
#3India23.60 million2.20%
#4Brazil19.05 million10.80%
#5Indonesia18.45 million8.50%
#6U.K.18.40 million31.80%
#7Turkey16.10 million23.60%
#8Saudi Arabia14.10 million50.40%
#9Mexico13.90 million13.60%
#10Thailand11.45 million19.00%
#11Philippines10.50 million12.60%
#12France10.00 million17.90%
#13Spain8.75 million21.20%
#14Canada7.9 million23.90%
#15Germany7.75 million10.50%
#16South Korea7.2 million15.60%
#17Argentina5.90 million16.30%
#18Egypt5.15 million7.00%
#19Malaysia4.40 million16.70%
#20Colombia4.30 million10.30%

Source: Hootsuite

Which countries use Twitter the most?

The United States has the most number of Twitter users with 76.9 million people using the app. Coming in second place is Japan with 58.9 million Twitter users.

RankCountryNumber of Users
#1United States76.9 million
#2Japan58.9 million
#3India23.6 million
#4Brazil19.05 million
#5Indonesia18.45 million
#6United Kingdom18.4 million
#7Turkey16.1 million
#8Saudi Arabia14.1 million
#9Mexico13.9 million
#10Thailand11.45 million
#11Philippines10.5 million
#12France10 million
#13Spain8.75 million
#14Canada7.9 million
#15Germany7.75 million

Source: Statista

Which countries visit Twitter the most?

The United States visited Twitter the most with 25.29% of traffic coming from the country.

CountryWeb Traffic
United States25.29%
Japan15.30%
United Kingdom5.22%
Brazil4.28%
Spain3.04%
Others46.88%

Source: Similarweb

Twitter Mobile App Stats: iOS vs Android

Key stat and key info for Twitter mobile app on iOS.

Key StatKey Info
Launched DateMay 1, 2010
Total Downloads1 billion+
Rating4.0 out of 5
Total Number of Votes20.65 million

Key stat and key info for Twitter mobile app on Android.

Key StatKey Info
Launched DateMay 19, 2010
Total Downloads
Rating4.7 out of 5
Total Number of Votes295,535

Sources: Google Play, Apple Store, Tech Crunch, Twitter

Twitter Funding History

Twitter was funded through 15 rounds and raised a total amount of $12.9 billion.

Twitter was last funded by Greenlight Capital with an undisclosed amount.

DateFunding RoundMoney Raised# of InvestorsLead Investor
Jan 8, 2010Series E - Twitter$5.2 million
Dec 15, 2010Series F - Twitter$200 million7Kleiner Perkins
Feb 9, 2011Secondary Market - Twitter$80 million1
August 2, 2011Series G - Twitter$400 million7DST Global
Sep 8, 2011Secondary Market - Twitter$400 million4
Dec 20, 2011Venture Round - Twitter$300 million1Alwaleen Bin Talal
Mar 1, 2021Post-IPO Debt- Twitter$1.3 billion
Mar 4, 2021Post-IPO Debt- Twitter$2.9 billion1Elon Musk Revocable Trust
May 4, 2021Post-IPO Debt- Twitter$7.2 billion19
Jul 1, 2021Post-IPO Debt- Twitter1Greenlight Capital

Source: Crunchbase

Twitter Investments

Twitter’s latest investment was on February 8, 2022, for OpenNode in a funding round called Series A - OpenNode which raised $20 million.

Announced DateOrganization NameLead InvestorFunding RoundMoney Raised
Feb 8, 2022OpenNodeSeries A - OpenNode$20 million
January 11, 2022Aleph HoldingYesCorporate Round - Aleph Holding
Oct 7, 2021AlterSeed Round - Alter$3 million
Apr 8, 2021ShareChatSeries E - ShareChat$502 million
Sep 24, 2020ShareChatSeries E - ShareChat$40 million
Sep 2, 2020SkillzPost-IPO Equity -Skillz$159 million
Aug 15, 2019ShareChatYesSeries D - ShareChat$100 million
Jun 2, 2017PlaySight InteractiveSeries C - PlaySight Interactive$11 million
October 1, 2014MIT Media LabNoGrant - MIT Media Lab$10 million
Oct 18, 2010OverdrivePrivate Equity Round - Overdrive

Source: Crunchbase

Twitter Financials

This section provides us with information on Twitter’s total assets, total liabilities, cash from investing, cash from financing and

Twitter Total Assets

Twitter had total assets of $14.06 billion in 2021, an increase of 5.08% in year-over-year growth.

YearTotal AssetsY/Y Change
2010$224.47 million
2011$720.68 million221.06% increase
2012$831.57 million15.39% increase
2013$3.37 billion305.26% increase
2014$5.58 billion65.58% increase
2015$6.44 billion15.41% increase
2016$6.80 billion5.59% increase
2017$7.41 billion8.97% increase
2018$10.16 billion37.11% increase
2019$12.70 billion25.00% increase
2020$13.38 billion5.35% increase
2021$14.06 billion5.08% increase

Source: Twitter

Twitter Total Liabilities

Twitter had total liabilities of $6.75 billion, an increase of 24.77% in year-over-year growth.

YearTotal LiabilitiesY/Y Change
2010$35.43 million
2011$87.39 million146.66% increase
2012$207.20 million137.10% increase
2013$416.23 million100.88% increase
2014$1.96 billion370.89% increase
2015$2.07 billion5.61% increase
2016$2.27 billion9.66% increase
2017$2.37 billion4.41% increase
2018$3.36 billion41.77% increase
2019$4.00 billion19.05% increase
2020$5.41 billion35.25% increase
2021$6.75 billion24.77% increase

Source: Twitter

Twitter: Operating Cash Flow

Twitter had an operating cash flow of $632.69 million in 2021.

YearOperating Cash Flow
2011-$70.60 million
2012-$27.93 million
2013$1.40 million
2014$81.80 million
2015$383.07 million
2016$763.06 million
2017$831.21 million
2018$1.33 billion
2019$1.30 billion
2020$992.87 million
2021$632.69 million

Source: Twitter

Twitter: Investing Cash Flow

Twitter had an investing cash flow of $52.62 million in 2021.

YearInvesting Cash Flow
2011-$324.88 million
2012$49.44 million
2013-$1.31 billion
2014-$1.10 billion
2015-$902.42 million
2016-$598.00 million
2017-$112.93 million
2018-$2.06 billion
2019-$1.12 billion
2020-$1.56 billion
2021$52.62 million

Source: Twitter

Twitter: Financing Cash Flow

Twitter had a financing cash flow of -$472.82 million in 2021.

YearFinancing Cash Flow
2011$480.21 million
2012-$37.12 million
2013-$1.94 billion
2014$1.70 billion
2015-$63.00 million
2016-$83.98 million
2017-$78.37 million
2018$978.12 million
2019-$286.18 million
2020$755.31 million
2021-$472.82 million

Source: Twitter

How much money does Twitter lose due to AdBlock?

Twitter loses $160.93 million of ad revenue due to AdBlock each year.

Daily Revenue Loss$440,908.90
Monthly Revenue Loss$13,227,267.06
Yearly Revenue Loss$160,931,749.23

Source: HypeStat

How many pageviews on Twitter are blocked by AdBlock?

Around 300 million pageviews are blocked on Twitter due to Adblock.

Daily Pageviews Blocked305,894,038
Monthly Pageviews Blocked9,176,821,152
Yearly Pageviews Blocked111,651,324,014

Source: HypeStat

Twitter Web Traffic Overview

Key StatKey Info
Daily Unique Visitors233,465,947
Monthly Visits7,074,018,194
Pages per Visitors10
Daily Pageviews2,276,893,011
Monthly Visits (SEMrush)8,266,532,740
Monthly Unique Visitors (SEMrush)2,233,113,276
Monthly Visits (Similarweb)6,934,632,099
Alexa Rank13
Alexa Reach3.789% (of global internet users)
Bounce Rate32.16%

Source: HypeStat

Twitter Traffic Sources

SourcesWeb Traffic Percentage
Direct54.67%
Referral10.35%
Search20.06%
Social14.92%
Paid0%

Source: HypeStat

How many people are using Twitter through their mobile app?

More than 90% of the web traffic on Twitter is coming from mobile devices.

Device UsedPercentage
Mobile90.07%
Desktop9.93%

Source: HypeStat

What is Jack Dorsey’s net worth?

According to Forbes, Jack Dorsey has a net worth of $6.1 billion in 2022.

YearNet Worth
2013$1.1 billion
2014$2.2 billion
2015$2.7 billion
2016$1 billion
2017$1.3 billion
2018$3.1 billion
2019$5.1 billion
2020$2.6 billion
2021$12.5 billion
2022$6.1 billion

Source: Forbes

What is Elon Musk’s Net Worth?

Elon Musk has a net worth of $219 billion in 2022

YearNet Worth
2013$2.7 billion
2014$8.4 billion
2015$12 billion
2016$10.7 billion
2017$13.9 billion
2018$19.9 billion
2019$22.3 billion
2020$24.6 billion
2021$151 billion
2022$219 billion

Source: Forbes

FAQs

No items found.

Want more of this, for free?

Hey! 👋 Over here, at SignHouse, we're producing more of what you just read.
Get our very quick email updates that we send to 1,000s of people. 100%-off invitations to access paid products for $0, value-packed emails + more

About the author

Ch Daniel is the co-founder of SignHouse and chairman of the CH Group. Daniel is leading the development of SignHouse's product, as well as strategising how else the company can reach its main mission: empowering 100M+ to use the world's most efficient document organisational tools.